| 1. Data Flow Programming Basics |
 |
In LabVIEW graphical programming, the order in which code executes is determined by the way that data gets transferred across wires on the block diagram. That's called data flow programming. |
| Time =4:04 |
| 2. Using Loops in LabVIEW |
 |
LabVIEW uses graphical loop structures like While Loops and For Loops to repeat section of code. |
| Time =4:08 |
| 3. LabVIEW Data Types |
 |
Numerics, text strings and Booleans are all examples of different LabVIEW data types. Each one is represented by a different wire colors, and different functions are available to let you convert between data types. |
| Time =4:25 |
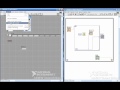
| 4. Using LabVIEW Case Structures |
 |
You can use LabVIEW Case Structures to programmatically execute sections of graphical code based on certain conditions. This is similar to "if... then... else..." statements in other programming languages. |
| Time =3:52 |
| 5. Using Arrays in NI LabVIEW |
 |
Watch this step-by-step demonstration to learn how you can use arrays to group elements of the same data type in NI LabVIEW. |
| Time =3:51 |
| 6. Using Clusters in LabVIEW |
 |
For more LabVIEW information, visit http://bit.ly/9hUf4b |
| Time =3:26 |
| 7. Creating Sub VIs in NI LabVIEW |
 |
Learn how to simplify block diagrams and make your code more modular by creating sub Vis in LabVIEW. |
| Time =5:23 |
| 8. Using Debugging Tools in NI LabVIEW |
 |
See how LabVIEW can automatically detect errors and help you debug your programs. |
| Time =3:31 |
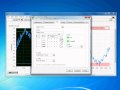
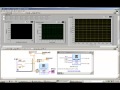
| 9. Using Charts and Graphs in NI LabVIEW |
|
Learn how to use waveform charts and graphs to visualize data trends over time in NI LabVIEW. |
| Time =3:17 |
| 10. Using the Tools Palette in NI LabVIEW |
 |
Watch this video to see how the tools palette works in NI LabVIEW. |
| Time =6:36 |
| 11. Programming Tutorial - LabVIEW for Education |
|
Watch this video to see how the tools palette works in NI LabVIEW. |
| Time =6:36 |
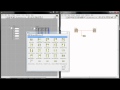
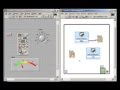
| 12. Building a Graphical User Interface (GUI) for Data Acquisition Applications |
 |
Use NI LabVIEW to create a custom user interface for data acquisition applications |
| Time =3:36 |
| 13. Dr. LabVIEW: Quick Drop Hotkeys |
 |
This video will show you a more in depth look at the Quick Drop feature with something new in LabVIEW |
| Time =1:09 |
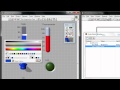
| 14. NI LabVIEW UI Tips: Add Decal to Button |
 |
Visit http://bit.ly/9lrhu7 for more UI tips! Spruce up your interface in LabVIEW with customized icons |
| Time =2:49 |
| 15. NI LabVIEW UI Tips: Using Panes |
 |
Visit http://bit.ly/9lrhu7 for more UI tips! Learn how to create panes in your front panel. |
| Time =3:54 |
| 16. NI LabVIEW UI Tips: Hide the LabVIEW Toolbar |
 |
Visit http://bit.ly/9lrhu7 for more UI tips!Hide the LabVIEW toolbar from the end use to create a more streamlined user interface |
| Time =1:51 |
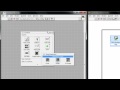
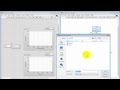
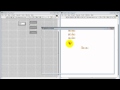
| 17. NI LabVIEW UI Tips: Create Decorations in Microsoft PowerPoint |
 |
Visit http://bit.ly/9lrhu7 for more UI tips! Use Microsoft PowerPoint to create custom backgrounds and imagery for your interface |
| Time =2:32 |
| 18. LabVIEW UI Tips - Recoloring Graphs |
 |
http://decibel.ni.com/content/groups/ui |
| Time =4:38 |
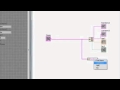
| 19. NI LabVIEW: Audio signal viewer |
 |
Create an audio signal viewer subVI that accepts a 1-D signal array and displays the array as its time-domain and frequency-domain (spectrum) representations. The signal viewer also plays the signal array as audio on the soundcard. |
| Time =6:49 |
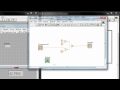
| 20. NI LabVIEW: Global variables |
 |
Learn how to create and use global variables, including: create a VI to hold multiple global variables, place a global variable in your VI, change the mode from write to read, and set default values. Global variables reduce wiring clutter when many subVI |
| Time =4:26 |
| create a local variable |
 |
|
| Time =2:59 |
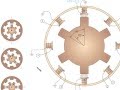
| Proteus ISIS and Arduino uno (Arduino UNO Simulator) |
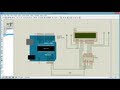 |
Servo motor control |
| Time =7:27 |
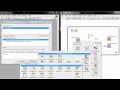
| Getting Started With the LabVIEW Interface for Arduino |
 |
In this video tutorial, I give an overview of what the Arduino hardware is and how the LabVIEW Interface for Arduino (LIFA) works. I demonstrate a simple program I wrote that scrolls 12 LEDs with a variable speed similar to the lights KITT had in the Kni |
| Time =10:00 |
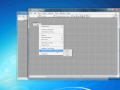
| How To Program The Arduino With LabVIEW Tutorial |
 |
Program the Arduino from LabVIEW. VI package manager installation instructions. Turn on arduino led with labview vi. |
| Time =12:08 |
| What is LabView and how are Analog and Digital Signals Interfaced? |
 |
Professor Kleitz provides video instruction on the uses of LabView and provides several interfacing ideas. |
| Time =13:57 |
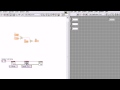
| LabView Basic Tutorial 1 (C-to-F Conversion) |
 |
Professor Bill Kleitz, author of Digital Electronics: A Practical Approach (Prentice-Hall) shows you how to create your first basic LabView VI |
| Time =8:39 |
| LabView Basic Tutorial 2 (For Loop, Do While and Arrays) |
 |
Professor Bill Kleitz, author of Digital Electronics: A Practical Approach (Prentice-Hall) shows you how to create your first basic LabView VI |
| Time =11:22 |
| LabView Charts and Graphs |
 |
Professor Kleitz uses LabView to demonstrate charts and graphs |
| Time =13:19 |
| labview shift register driving a stepper motor |
 |
Professor Kleitz uses LabView to build a shift register to drive a stepper motor |
| Time =12:40 |
| LabView DAQ Assistant for Analog IO |
 |
Professor Kleitz uses LabView to Input and Output analog values |
| Time =10:36 |
| LabView Case Statement |
 |
Professor Kleitz uses LabView to demonstrate the Case statement and formula nodes |
| Time =9:08 |


